Graphs
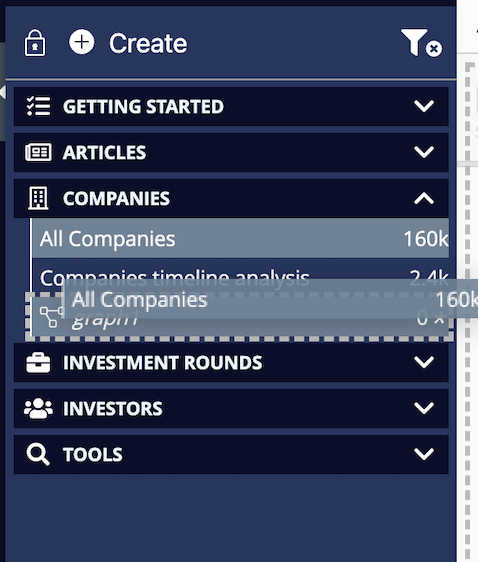
All saved graphs are automatically added to the sidebar. Like dashboards, they can appear anywhere on the sidebar. You can view the graphs in graph visualizers, which are full screen graph browser visualizations that open the graphs on the sidebar.
Creating graphs
You can create a graph from the sidebar or from a graph browser visualization on a dashboard.
To create it from the sidebar:
-
Click Create → Graph object.
-
Name the graph and click Create. The graph opens up in the default graph visualizer.
Adding nodes to a graph from a dashboard
To do this, do one of the following:
-
Drag a dashboard onto a graph directly in the sidebar.

-
If the graph is open, drag a dashboard directly onto the visualizer. This is like how you add nodes to a graph browser visualization on a dashboard.
Adding nodes to a graph from another graph
To do this, do one of the following:
-
Drag the graph directly onto another graph on the sidebar.
-
Drag the graph onto a graph open on the visualizer.
Saving graphs
To save a graph, do one of the following:
-
Open the graph and from the toolbar, click Save.
-
From the sidebar, right-click the graph and click Save.
|
Unsaved graphs appear in italics with an asterisk '*' next to the count.
|
To save a graph as a new graph:
-
Open the graph.
-
From the graph toolbar, click Save → As new graph.
-
Name the new graph and click Save.
Renaming graphs
-
From the sidebar, right-click the graph and select Rename.
-
Give a new name for the graph and click Rename.
Restoring graphs
You can restore an unsaved graph to its latest state in Elasticsearch. This discards any changes made on the graph.
To do this, right-click the graph and select Restore saved graph.
Setting the default visualizer
By default, when a dataspace is created, a graph browser visualization is added and set as the default visualizer. This is the visualization with which you view graphs on the sidebar.
To change the default visualizer:
-
From the menu bar, click Management → Advanced Settings.
-
Edit
siren:defaultGraphVisualizerIdand select another graph browser.
|
A graph browser set as the |
