Navigating the graph
To help you analyze your data, there are a variety of tools that you can use to navigate the graph, organize the nodes and visualize the data.
The navigation bar is on the left of the graph browser.
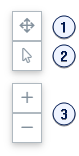
-
Fit the whole graph or the selected nodes to the visualization.
-
Click to switch between the selector and panning tool.
-
Zoom
Toolbar
The toolbar contains functions that control the files, the layout, and the management and display of nodes in the graph.
For more information, see Using the toolbar.
Graph data visualization
You can use Relations, Styles, Cards, and selection tools to help you navigate and view your data. For more information, see Controlling graph data visualization.