Relational browsing
Siren Investigate enables you to filter documents on a dashboard by showing only those that have a relation with documents displayed on a different dashboard, possibly stored in different indices.
Relational Navigator
The Relational Navigator component typically requires no configuration. It automatically discovers all possible destinations based on relationships between indices defined in the Data model app.
It can be reused across any dashboard (there is no need to create different ones for different dashboards).
Each dashboard has an associated entity table, which is based on an underlying index pattern. If the entity tables from two dashboards have a relational connection, this relationship is shown by the Relational Navigator, by default.
It is really much simpler than it sounds. Drop this component into a dashboard which is associated with an entity table or search and it will show you all the possible relational connections with other dashboards which have related entities.
| The relational filter visualization requires Siren Federate. |
Index to index relations
When two entities are directly connected
For example, let’s take the following indices:
article |
an index containing articles; each document in the index has
a field called |
company |
an index containing information about companies; each
document in the index has a field called |
Both indices are configured so that they are joined on the field companies of article with
the field id of company. Then, it is possible to use that
configuration to create a relational filter that would filter companies
based on connected articles (or vice-versa).
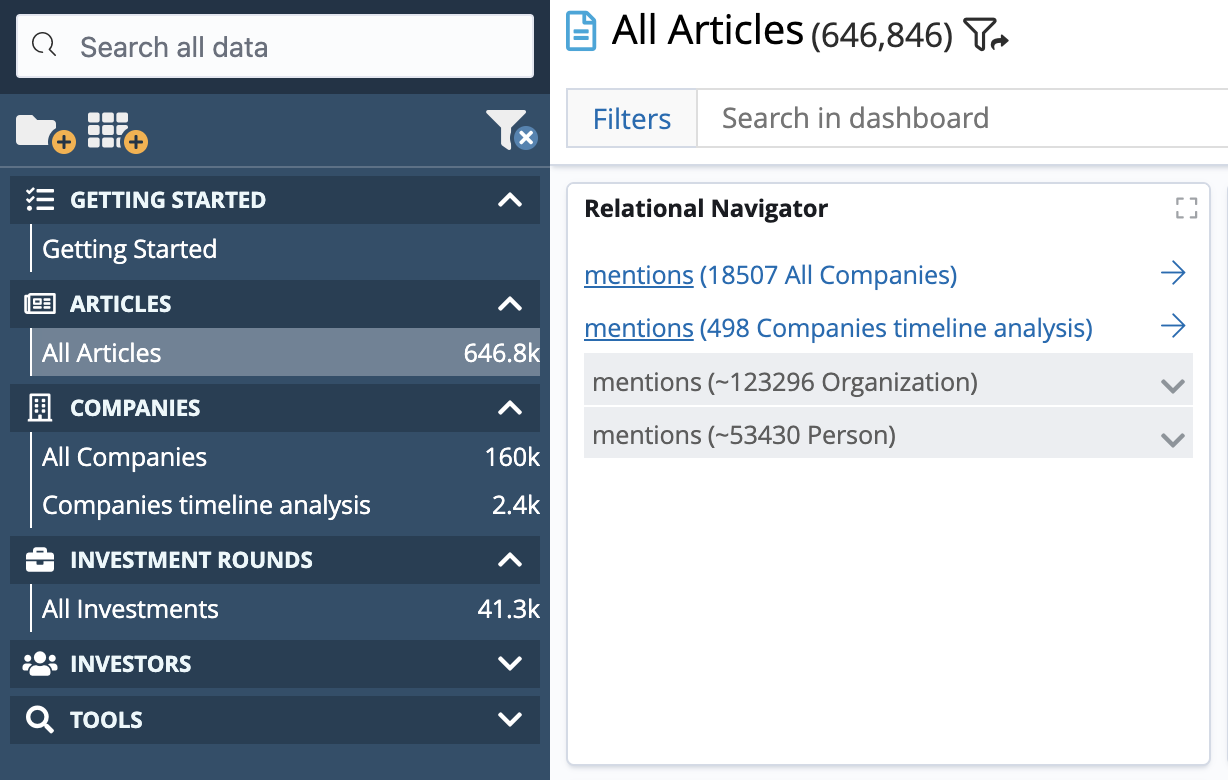
In the Articles dashboard, the relational navigator visualization is displayed as a button which indicates the number of documents in the Companies dashboard that are mentioned in the articles of the current dashboard.
The following image shows the button for the relation described in the example; there are two possible destinations from 646,846 articles currently displayed
-
18507 companies on
All companiesdashboard -
498 companies on
Companies timeline analysisdashboard
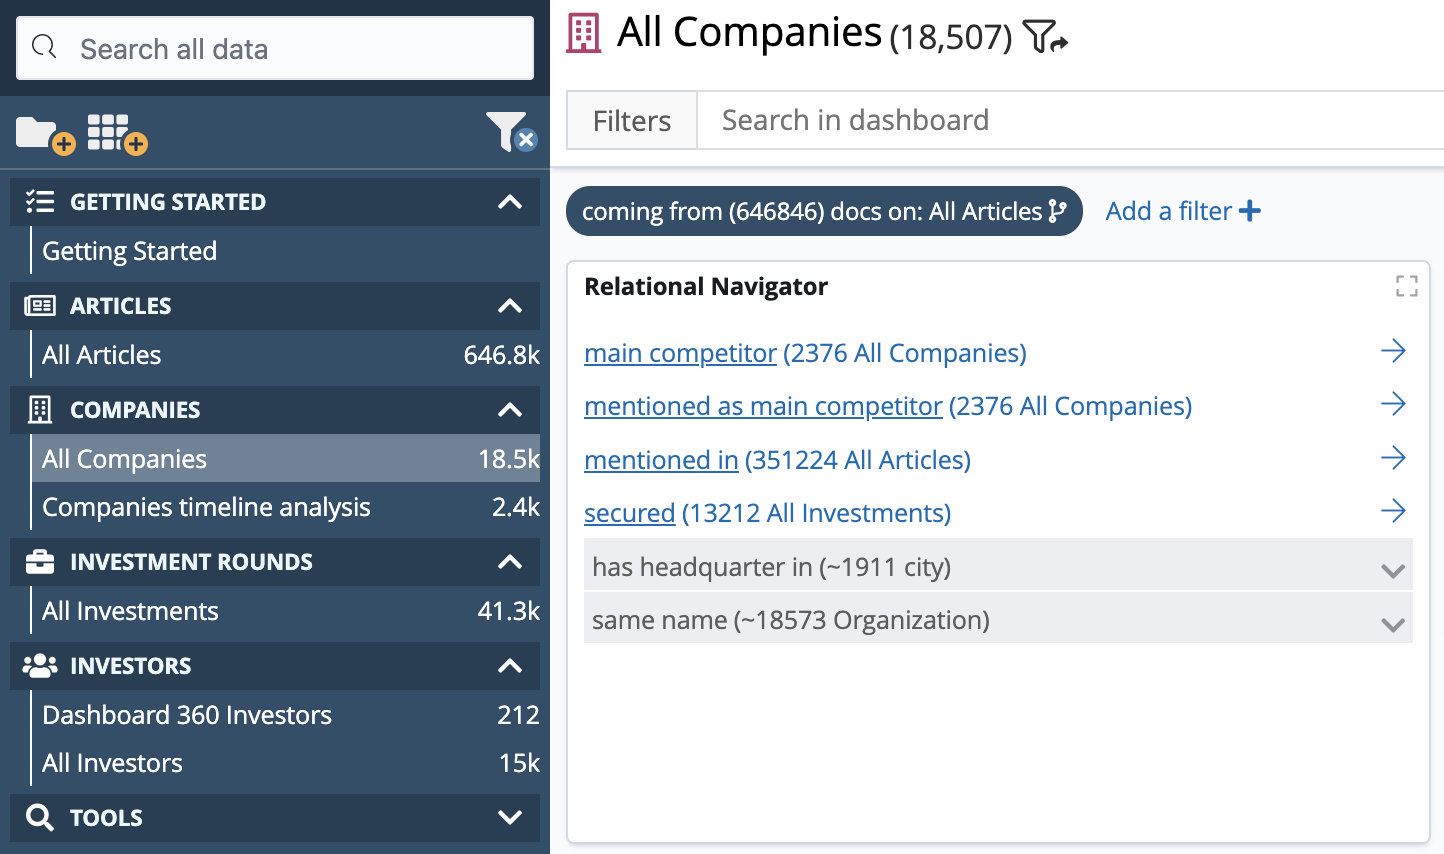
Clicking the first button will switch you to the Companies dashboard and display the 18507 companies; the relational filter is displayed in the filter bar:
Index to entity Identifier relations
When two entities are connected using Entity Identifier
For example, let’s take the following indices:
company |
an index containing information about companies; each
document in the index has a field called |
investor |
an index containing articles; each document in the index
has a field called |
city |
an entity identifier which represent the concept of a city |
There is no direct relation between investor and company but thanks to the city entity identifier the Relational Navigator is able to join the two. The following image shows a button for a relation using the entity identifier described previously.
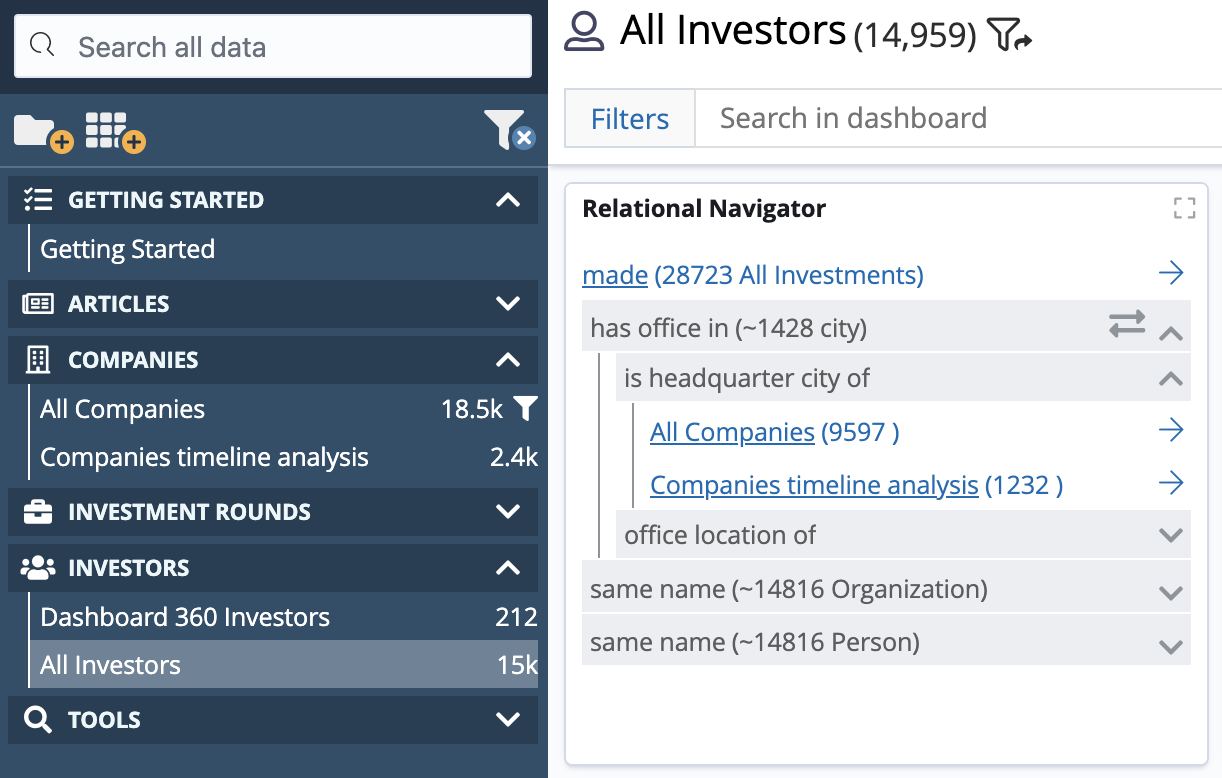
There are two possible destinations using is headquarter city of relation from the 15k investors currently displayed:
-
9597 companies on
All companiesdashboard. -
1232 companies on
Companies timeline analysisdashboard.
Ordering
Click on the Order button to switch the ordering:
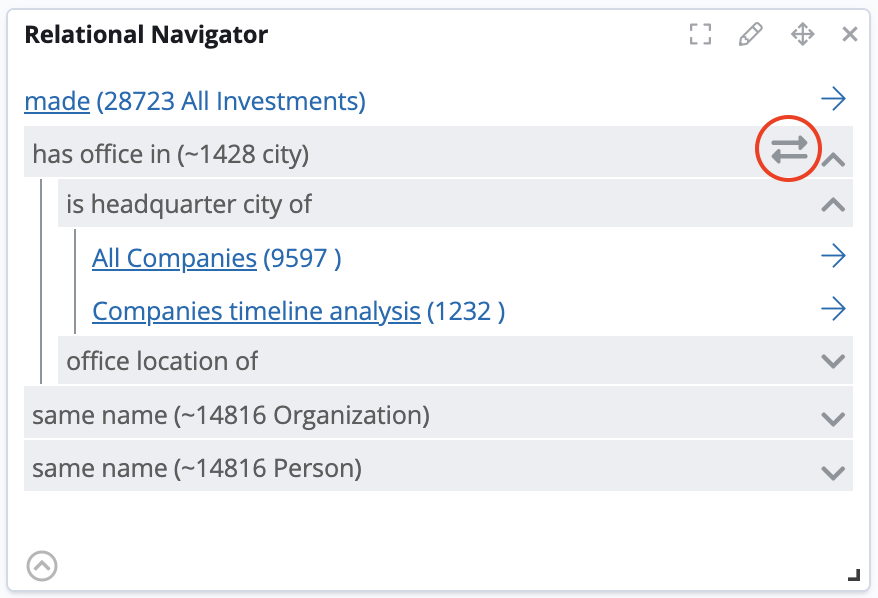
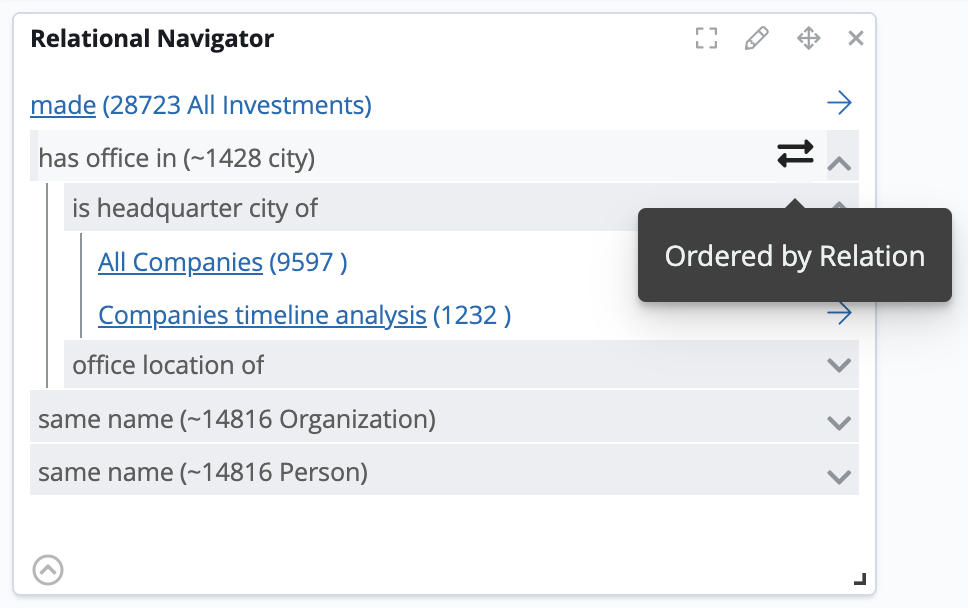
There are two possible ways to navigate the tree of possible destinations, we can order by:
dashboards - where you first see the relation and then the destination dashboards
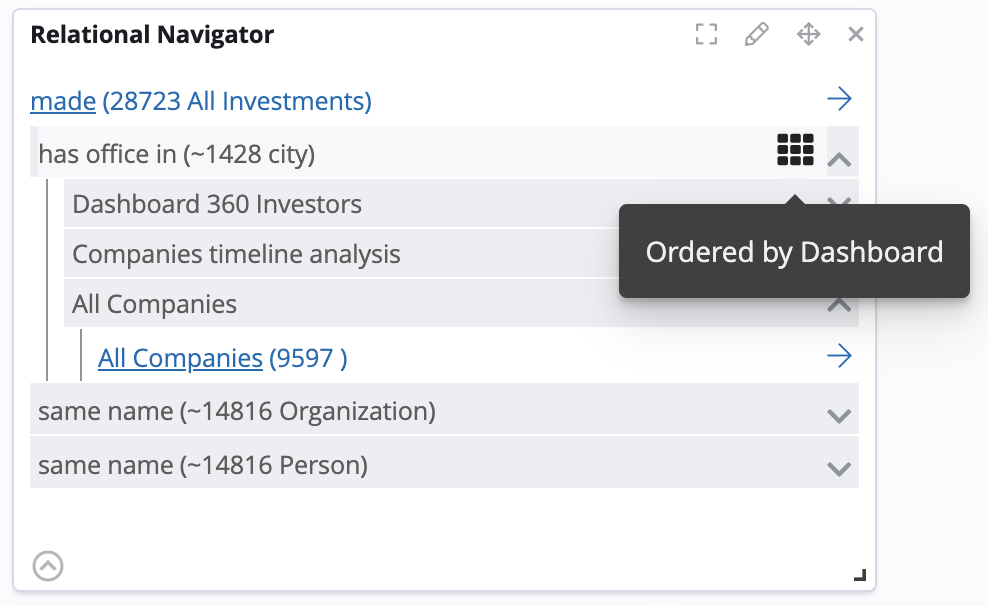
relations - where you first see the destination dashboards and then which relation you can reach it with
Configuration
All possible relations are discovered automatically.
Grouping
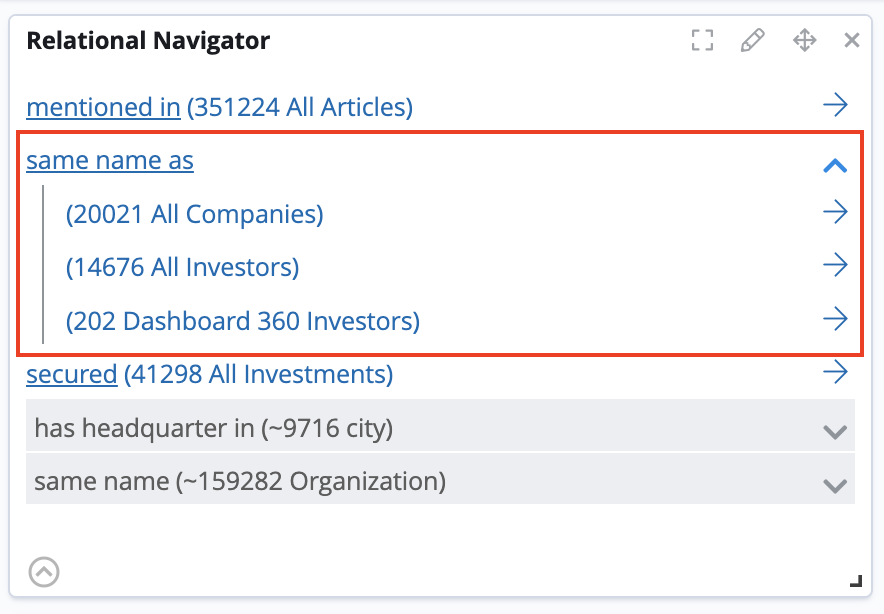
You can group entity relations by label by checking Group entity table relations:
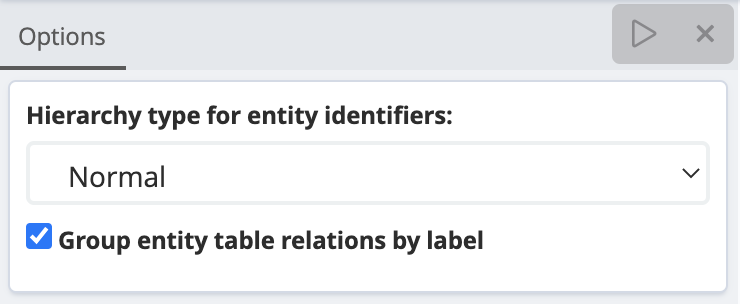
When the option is enabled, the target dashboards for relations with the same name will be grouped together:
Hierarchy types (layout)
There are two possible values:
Normal - the entity identifiers subtree layout is EIDs → relations → dashboards or EID → dashboards → relations
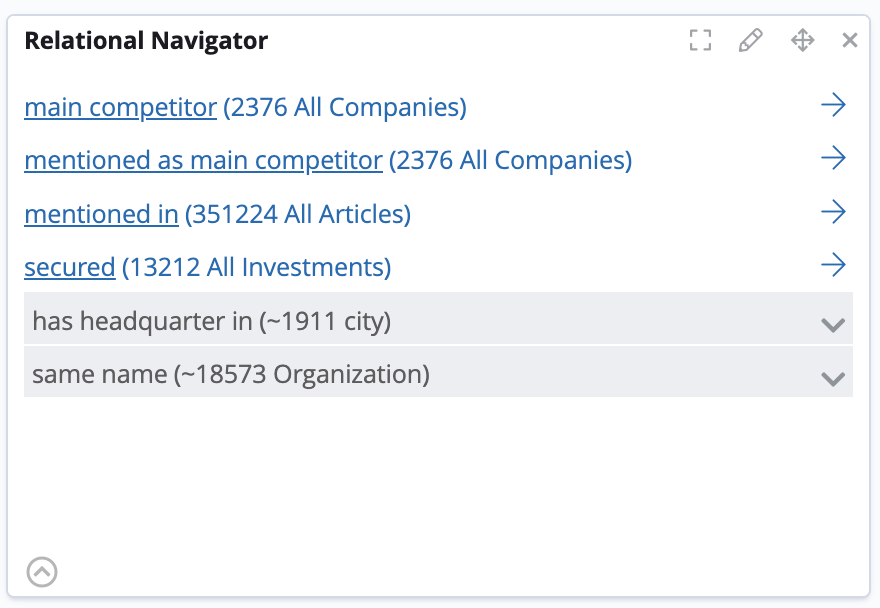
Light - the entity identifiers subtree layout is collapsed into EIDs → relations → dashboards or EID → dashboards → relations
The following image shows the Light layout activated
Records-as-relations
Records-as-relations are listed in the Relational Navigator each with its own section. Expand the section to see the dashboard links. Those that have a manually defined label use that label name, the relation and its inverse are listed separately. Those that use a field value as a label are combined and listed under [*]. To view and select the individual relations that you want to apply, click [*].
For more information about records-as-relations, see Records-as-relations.
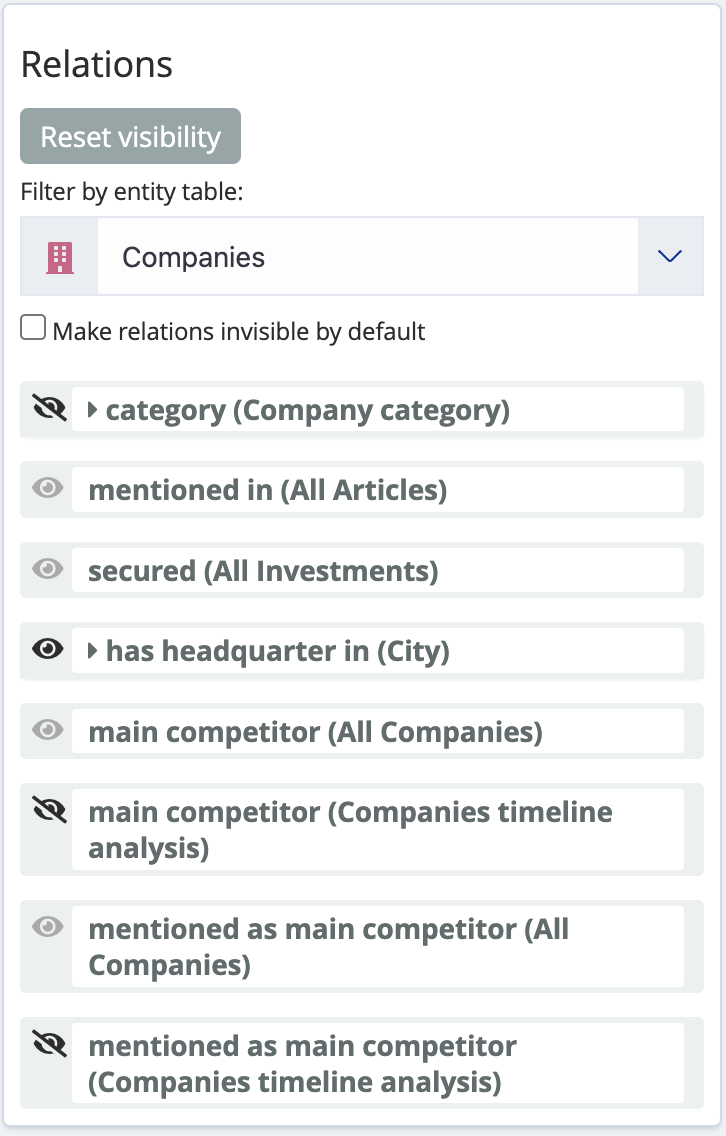
Hiding and showing relations
Use the visibility buttons to hide or show individual relations. All relations are visible by default.
To set the default visibility to false, select the Make relations invisible by default checkbox.
| Changing the default visibility doesn’t apply to relations that were individually hidden or made visible. |
