What’s new in Siren Platform 15.1
For a full list of improvements, fixes, and security enhancements, see the release notes.
Siren Investigate is compatible with the Siren AI plugin. Explore all the possibilities with K9, to get started see Siren AI.
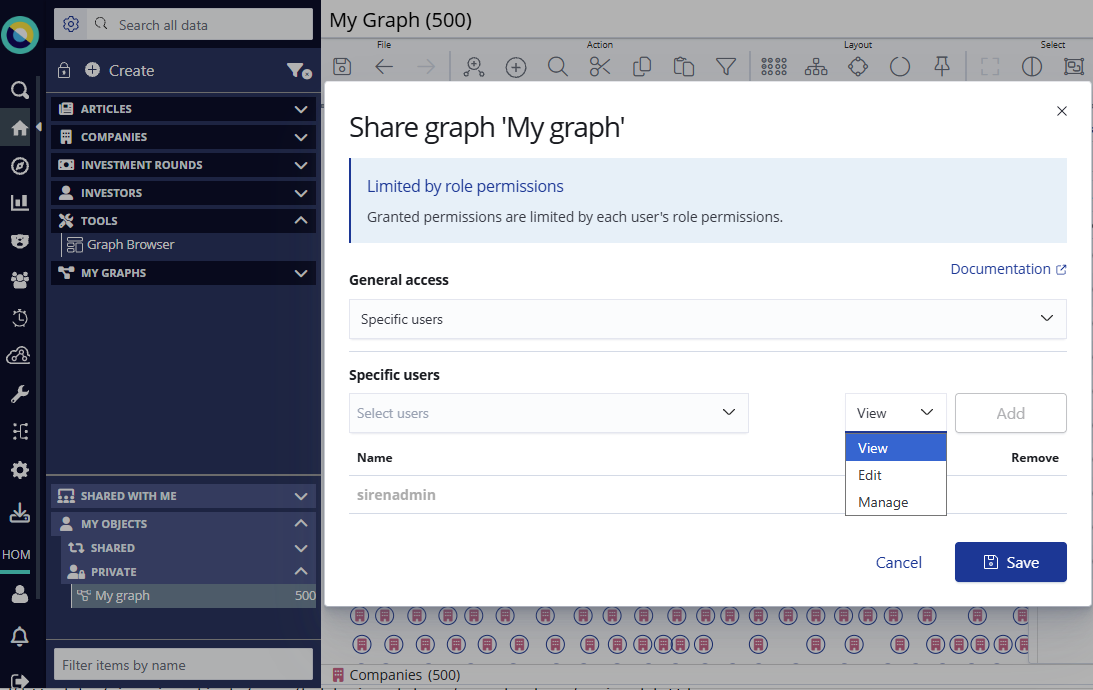
Sharing graphs and dashboards with other users
You can now share your graphs and dashboards with other users and manage the access level they have. Open your work to collaboration and feedback while being confident that you can grant the right level of access: view, edit, or manage permissions.
For more information, see Sharing with users.
New Siren map
This release gives us the new Siren map. This one map replaces the enhanced tile map and region map visualizations with a single unified map visualization that you can use on both dashboards and within your graphs.
The transition is smooth, as existing systems with enhanced_tile_map or region_map visualizations will automatically migrate to the Siren map during upgrade. For configuration details, see
Map visualization.
Viewing nodes with and without geo-coordinates
Map mode in the graph is now more flexible. You can simultaneously visualize nodes with and without geo-coordinates. From the graph toolbar, simply click Map and select your preferred node view.
Pin nodes in your graph layout
Pin nodes on the graph to stabilize your layout so that it is not rearranged when you add new elements. Both the nodes and their connected nodes will stay put. This is beneficial for when you add elements but want to keep your focus on one set of nodes.
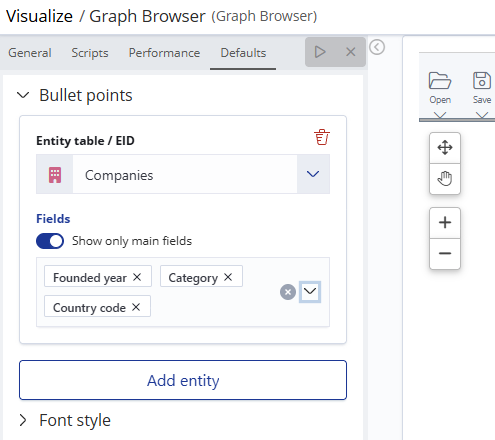
Fields visible on entity type nodes by default
Fields can now appear as bullet points under nodes specified by entity type. You can set this as a default in Graph Browser settings. For more information, see Bullet points under default settings.