Using lenses
Lenses can alter the nodes or connecting lines that are displayed in the Graph Browser.
To work with lenses, in the rightmost side panel, click Styles.
Lens types
- Transform
-
Node to edge: Streamline your graph to transform the middle entities between two indirectly-connected nodes into edges (connecting lines) rather than as nodes themselves. To create this type of lens, select the entity that you want to skip over (the middle entity). Then select a left relation and a right relation.
- Color
-
Color from field: Select an entity and a field and apply a color schema to its node icons, so that nodes generated by that field can be categorized by color. For example, you can apply the same color to all nodes that are based in a specific country. The Legend tooltip checkbox displays a tooltip that shows the field that is the source of the color lens.
- Advanced
-
-
Advanced lens: Specify a JavaScript expression to apply conditions that, when satisfied, change the selected nodes' appearance or visibility. For more information, see Applying an advanced lens.
-
Graph metric: Advanced users with an understanding of graph algorithms can set the following metrics for nodes.
-
Betweenness
-
Closeness
-
Eigenvector
-
Degree
-
Pagerank
-
Components
-
Cluster
-
-
- Label
-
Label from expression: Set a node’s label by using an expression. For example, you can set an investment node to display the amount and year of the investment.
- Size
-
Size from expression: Use a log scale to adjust the node size according to an expression.
- Spatio-temporal
-
-
Time/location set lens: Set a node’s time and geographic location from field values. This can be useful if you want to display nodes in Timebar mode or Map mode and you want to override the temporal or geographic values that the nodes already have. Or, if your data contains a latitude value in one field and a longitude value in another field, you can select those fields and the lens combines them into a single location for the node.
-
Temporal connection: This lens is useful if you have data that can show how entities move through space over time. It is best applied when you are using with Timebar mode and Map mode.
-
- Tooltip
-
Show record content on tooltips: Displays information from the entity record.
Applying advanced lenses
With advanced lenses you can change the selected nodes' appearance, visibility, or geographic or temporal properties. You can choose to apply a lens always, only for the selected nodes, or only when a JavaScript condition is true. For more information about composing lens expressions, see Configuring Jexl operators.
The following properties of a node can be altered by an advanced lens:
-
Color: Specify a hexadecimal color code. You can use an online color picker, such as W3Schools color picker to help you select a color code.
-
Node font icon: Specify the icon that you want to apply from a range of Font Awesome icons. Each icon has a HTML code name, such as
far fa-times, which you can find on the Font Awesome site. -
Node glyphs: These are bubbles or icons that can be shown on a node to display specific information. You can modify the position of the glyph on a node to display it at the northwest (
nw), northeast (ne), southwest (sw), or southeast (se) point of the node. -
Hidden: Hide a node to remove it from your graph analysis.
-
Label: Specify a custom label on a node.
-
Location: Specify the latitude and longitude values for a node.
-
Node image: Instead of an icon, set a node to display an image.
Node icons that link to Web images are not always shown properly due to security restrictions. You may need to configure the Image Proxy feature to display them. -
Size: Alter the size of a node.
-
Time: Specify a timestamp value for a node.
-
Tooltip: Specify a custom HTML tooltip for a node.
-
Halo: Add a circle around a node, which can highlight or emphasize specific information. In the To field, you can set the radius, the line width, and the color of the circles.
The halo is influenced by the node scale. If you scale the node by a factor of two, the halo also scales by a factor of two.
Creating custom lenses
-
Click Styles to open the lenses pop-out.
-
From Create lens, select the lens type.
-
Name the lens.
-
In Entity type, select the entities that the lens applies to.
-
Configure the lens depending on its type.
-
Select if the lens is enabled on the graph, map, or both graph and map.
-
Click Save lens and click the save changes button.
Example of applying lenses
An analyst is investigating the success of companies founded in 1990 and wants to visualize their stock exchange status on their nodes.
They drag a filtered set of companies into the graph but want to the change the color of the nodes.
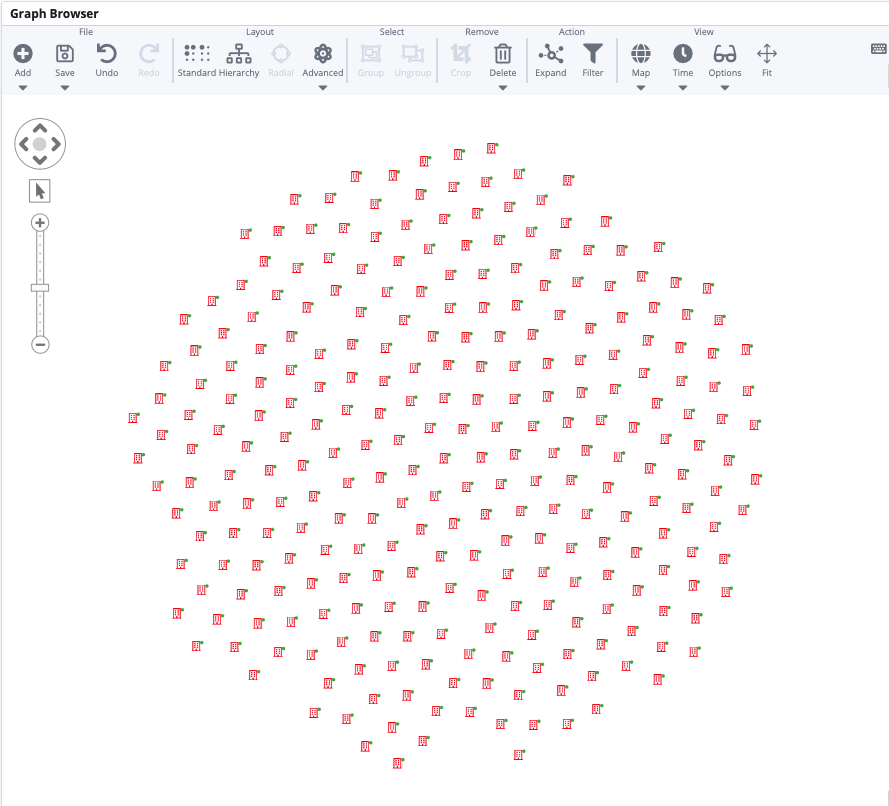
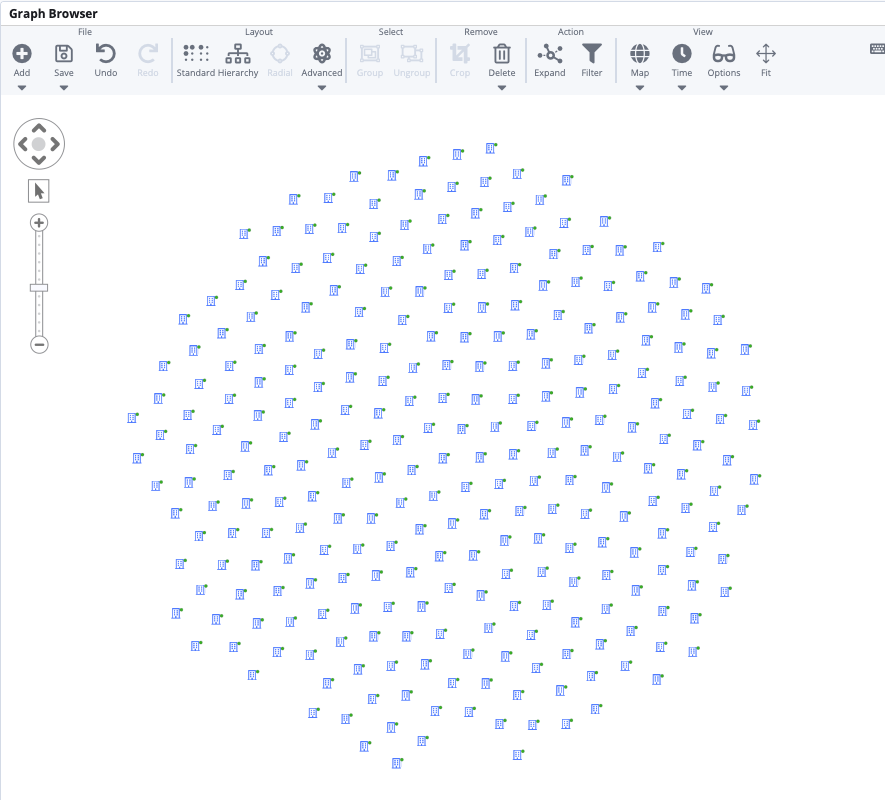
They create an advanced lens and specify a new color to apply to all company nodes, changing them from red (#ff0000) to blue (#4d79ff).
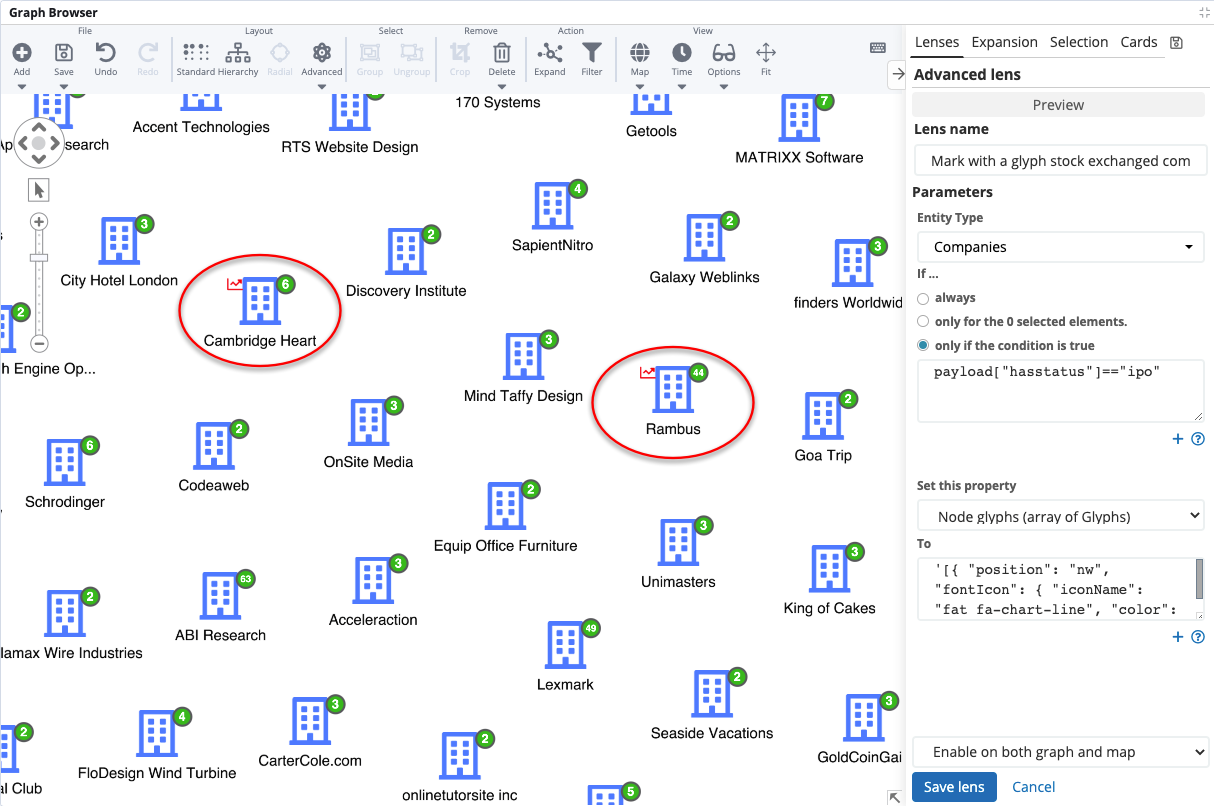
Next, they create a lens to apply a glyph to those companies that are on the stock exchange as follows:
-
They select Advanced lens and select Companies as the entity type.
-
In If, they click only if the condition is true.
-
They specify the condition
payload["hasstatus"]=="ipo". -
From the Set this property dropdown menu, they select Node glyphs (array of glyphs).
-
In the field below, they enter the following expression:
'[{ "position": "nw", "fontIcon": { "iconName": "fat fa-chart-line", "color": "#f00" } }]' -
They click Preview to check the result and save the lens.
As a result, the analyst can now see glyphs on the nodes of the companies that are on the stock exchange.